The joint Jisc- ALT webinar had a fantastic turn out with 127 registered to attend the event and join in the #Co-design16 challenge discussion on ‘How can we use data to improve teaching and learning?’
The full recording is available at http://bit.ly/2gGfFGx,
Areas covered included; evidence to demystify myths, as well as how to use data to inform rather than drive how curriculum enhancements, link qualitative survey data with behavioural quantitative data often associated with Learner analytics, supplementing engagement data to TEF measures, new data sources like ULN/PLR. Whilst grappling with the issues of how to get the data out of the systems!
Below are some highlights with Sarah Davies beginning by following up on Andy’s ‘Here be data monsters’ blog http://bit.ly/2guVdXX where he asks if we should stay away or explorer further these 5 monsters?
- Data-informed course improvements
- Research based on analytics ‘big data’
- Collating evidence on what works
- Designing for maximum employability
- Monitoring reactions for real-time improvements
But the collective cry from the #Codesign16 consultation so far warns about the danger of over-reliance on data and the importance of:
- Narrative
- Student engagement
- Understanding in the round
- Qualitative measures
After Sarah’s introduction there was plenty of interesting chatbox comments as listed below;
| Martin Hawksey (ALT) | 13:15 | |||
| personally it worries me to see an absence of theory when using data in learning and teaching | ||||
|
Lina Petrakieva (GCU) |
13:17 | |||
| The problem is that theories are developed from data and we are still in the process of collecting and making sense of that data | ||||
| Rebecca Galley (OU) | 13:18 | |||
| No they are proven by data | ||||
|
jasper shotts |
13:21 | |||
| Need to make survey activities relevant to learners and context of learning – that way tiny adjustments to survey design and good timing can yield data of greater value | ||||
Jasper’s point above is pertinent given Jisc’s recent work investigating students’ expectations of the digital environment and have just deployed the Digital Student Experience Tracker. QAA and HEA have also been doing a lot of work with the sector around how to better use survey data in the quality enhancement processes.
Rebecca’s myth busting activity below got a lot of likes from other participants:
| Rebecca Galley (OU) | 13:22 |
| Lol – you could start anywhere. A colleague here has a ‘myths’ board. We put regularly cited ‘facts’ about what students do or don’t do, like or don’t like and he checks out the data to see if he can prove or disprove them | |
Marieke Guy (QAA) tweeted: #codesign16 Already some concerns over ‘data-driven’ decision making – ‘data-informed’ preferred …responsible metrics and all that 😉
| Marieke Guy | 13:35 |
| Still much work to be done on outcome measures and how they relate to good quality teaching (think TEF?!) – so one for Rebecca’s myth board is NSS scores and the connection to challenging teaching approaches. | |
| Rebecca Galley (OU) | 13:37 |
| @Marieke Indeed – the relationship between satisfaction, engagement, pass and progression (e.g. employability/ destination) is complex. We need to decide how we prioritise these. | |
Joe introduced a new data source:
| Joe Wilson | 13:22 |
| It is worth looking at the data structures / data sets that are already available in Scotland Scottish Candidate number and information on progression for those 16-24 held by Skills Development Scotland and bits with Scottish Funding Council In England ULN (universal candidate number) and in England for candidates on certain programmes ILR individual learning Record ( so many learners have a learning record ? and a unique identifier ) | |
| Ross Anderson (North Lindsey College) | 13:23 |
| Our Jisc Student Data Service information was very interesting and prompted a few surprises | |
Jisc Student Tracker tool Interesting reference from Brain:
| BrianWhalley | 13:28 |
| Something about criteria and generating result data with students at http://www.tandfonline.com/doi/full/10.11120/plan.2008.00200029?scroll=top&needAccess=true | |
Dan raises an interesting point about how to categorise different sorts of data:
| Dan 1 | 13:29 | |
| would it be worthwhile for this to be organised by pedagogical teaching methods so that individuals can look to improve specific aspects of a course i need of improvement to offer insights of development eg. formative assessment, or peer learning etc. | ||
| jasper shotts | 13:31 | |
| yes I agree with capturing pedagogic intent – simply working to best “outcomes” might dilute/narrow the learning experience – | ||
John reinforces the point made by Sheila MacNeill in her blog ‘… I have to overcome my biggest problem and that is actually getting at the data. I’ve blogged about this before and shared our experiences at this year’s ALT conference. It is still “a big issue.” As is consent, and increasingly, data processing agreements.
| John Langford | 13:32 |
| In terms of data sources, there is a limit to what can be extracted due to limitations on actual access to data, particularly for institutions that are hosted. | |
Lina introduces a new angle by mentioning the challenges in gathering data from different types of study: – how is this being address in the Learner analytics world?
| Lina Petrakieva (GCU) | |
| We have two very different sets of data that we need to take into account and each of them provide different challenges – own time study (online and offline) and class teaching study | |
Brian references a blog that asks ‘….whether we put too much faith in numerical analysis in general and complex learning analytics in particular’
| BrianWhalley | 13:34 |
| Wrt general analytics, Mike Feldstein recently posted: http://preview.tinyurl.com/zhbl6ku | |
There was a lot of discussion around sharing data with students directly, but caution was raised, and advice that tutors should interpret the data and discussed with the students, as many institutions are doing in the Jisc Learner Analytics communities
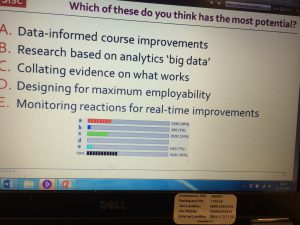
The delegates were then asked to vote on which ‘monsters’ have the most potential;
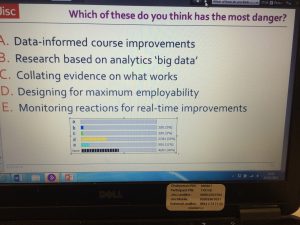
Delegates voted for 1st None, 2nd A: Data informed course improvement and a closely followed 3rd C: collating evidence on what works.
Whilst they voted that None then D: Designing for maximum employability, were the most dangerous!
| BrianWhalley | 13:46 | |
| My worry about B is that institutions will go for this to ‘prove’ their TEF | ||
| Patrick | 13:49 | |
| I prefer that D is about students achieving their goals. This is a key element of how
is success measured in HE? Maybe this is more of the narrative that will support TEF self assessments |
||
Dan mentioned that for FE, employability is their bread and butter, whilst HE delegates wanted to ensure that they aren’t just a production line for employers and that HE is about deep learning and critical thinking. Are these the same terms but in different contexts?
| Ross Anderson (North Lindsey College) | ||
| Student voice, surveys, curriculum design, course evaluations, links with employers are all some of the things we use for A | ||
| Ross Anderson (North Lindsey College) | 13:47 | |
| I think there is a difference in what FE and HE see as employability | ||
| Samantha | 13:12 |
| skills required for employability vary widely over time, would be concerned about curriculum tailored more to meet business needs/trends at the expense of a more holistic learning orientated course | |
| Stephen 1 | 13:47 | |
| A danger in a HE context is generalisation across subjects and disciplines and institutions.
Several liked Megan’s comment: |
||
| Megan Robertson (Aston U) | 13:50 | |
| Teaching Degree Apprentices we emphasise that we’re giving them tools for their CAREER not their present job | ||
CRA webinar also just had this debate in a Measure of Success Webinar capturing Learning Gain for Work placements webinar.
| Joe Wilson | 13:50 |
| @sam so it is an ongoing iterative process to give learners skills they need for jobs market – and does impact on course design | |
But the last word goes to Rebecca:
| Rebecca Galley (OU) | 13:53 |
| I think data is better at telling us what doesn’t work rather than what does. There is a risk that it pushes us down risk-averse and vanilla learning and teaching routes | |
So areas covered were; evidence to demystify myths, as well as how to use data to inform rather than drive how curriculum enhancements, link qualitative survey data with behavioural quantitative data often associated with Learner analytics, supplementing engagement data to TEF measures, new data sources like ULN/PLR. Whilst grappling with the issues of how to get the data out of the systems!
Please stay engaged in the #Codesign16 consultation as we move into the next phase of ideas identification, which we would like you to vote on in the new year, so keep an eye on this blog.


One reply on “Joint Jisc ALT #Codesign16 Data informed webinar”
FE is about employability but in a lot of cases it is about self employment rather than a production line for employers.
HE may be about higher level studies but to suggest individuals go into it for the academic element alone is possibly short sighted – I’m not sure there are many people who can afford ~£9k a year fees without thinking about employment to pay them off.