It’s past time I wrote something about how we’re getting along with our technical Learning Analytics system! I’m Jisc’s technical analytics innovator, and so far on the project I’ve been working on a few bits of the technological ‘glue’ which helps the various components of our learning analytics system interact.
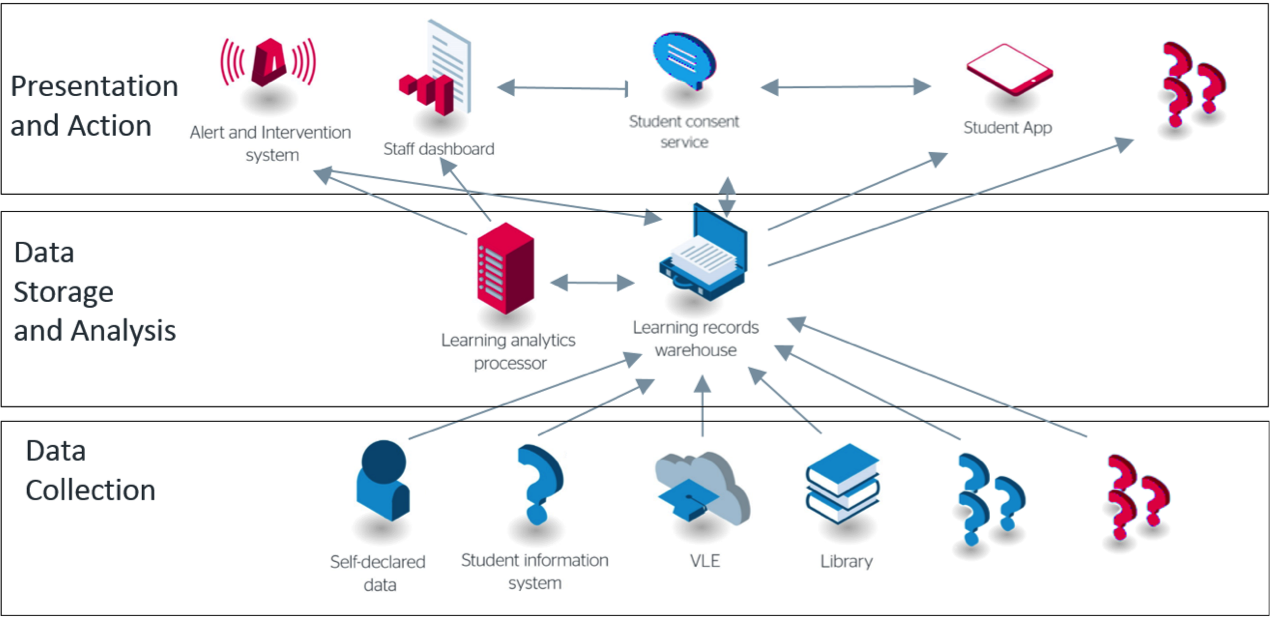
Jisc Learning Analytics Architecture
We’ve previously blogged a little about our architecture and some of the components like the Learning Records Warehouse and the Student App, but for the purposes of this article I’ll recap a little. Our whole architecture hangs off the Learning Records Warehouse at the centre. Here we’ll collect together all kinds of data about student activity by connecting to various student systems. These systems might be VLEs like Moodle or Blackboard, Library systems, student records systems, or anything else we can find and wire up such as self-declared data via our student app.
In order to include data from a given system into our warehouse, we either need to extract the data and then load it into our warehouse, or we need direct support for that system to load the data into the warehouse itself. In the case of some vendors, support for extracting the data at all is already quite limited, so by working with vendors to enable direct data insertion we are enriching the functionality available to the sector as a whole!
Reviewing the space, we found that the xAPI specification already existed for passing learning data between systems, and there was already an xAPI plugin for the Moodle VLE, so we kick-started the project by demonstrating that we could get data into the learning records warehouse from Moodle, whilst at the same time commissioning an xAPI plugin for Blackboard which will be released to the sector. Along the way we have taken on maintenance of the open source Moodle plugin, and some of our collaborators have already made enhancements such as the ability to batch-upload statements rather than uploading them one-by-one in real time.
xAPI has been constructed to transmit metadata about events. The minimum set of metadata it conveys is based around the semantic actor/verb/object structure, for example: ‘user, logged into, VLE’, or ‘user, attempted, assessment’, etc. However, these individual events can be enriched by a variety of supporting metadata. It might be useful to know the time the event happened, for instance. We can also say what the source of the event was — Moodle, Blackboard, etc. Many events relate to activity on a certain course module, so we can return that information too. In working out the complete set of information which it is useful to store in our learning records warehouse, we are building up an xAPI vocabulary for use across our learning analytics project, which defines what standard data fields we would like systems to return, and which data fields we require to enrich specific events. Originally we used a smaller set based on what was available from the Moodle xAPI plugin, but as we added in the blackboard plugin and started making our own developments on the Moodle plugin we expanded this set. All these discussions take place in full view on our github site, where you can also view the latest version of our xAPI vocabulary.
These are the currently platform independent documented recipes:
That was all well and good for getting going with VLEs, and so the next part of the puzzle we set to work on was student records. In a similar way, we wanted to understand what kind of information we could get from student records systems, and what would be useful to feed to our machine learning processes. In this case, the data was less about what was returned by different off-the-shelf systems, and more about what was available from different institutions.
Our starting point, then, was the standard source of data which all HE institutions have to be able to provide — the HESA return. The Universal Data Definition for use in UK academia. Once we got involved with the developers of the various other components of our learning analytics system, however, we started to iron out what the key fields were so that we could decipher the xAPI data and feed the complete dataset into machine learning processes in order to return useful predictions.
As before, we used github to hold these discussions in a public forum, and at the time of this writing we are on version 1.2.4 of our UDD. The next step has been obtaining records from partner institutions and transforming them so that they fit this data model, and then loading them into the learning records warehouse from which they can be accessed via an API.

I mentioned that this has all so far been for HE, but we are making good progress with expanding this data model to include the kinds of data held in student systems by FE institutions.

Now that we have both VLE and student records data in the warehouse, we are ready to go with the components further along in our architecture — although the warehouse is a powerful tool in and of itself and it is an interesting step to look at what kinds of visualisations are possible just by combining the raw data from the two types of system. We recently ran a hackathon at the LAK ’16 conference in which we invited people to participate and produce visualisations from a dummy dataset held by the ‘University of Jisc’, and we were satisfied that it is possible to produce meaningful insights before we reach the machine learning step. To facilitate the hackathon session, I came up with a list of sample queries which could be used to explore the data in the warehouse, some of which were derived from real queries we had prototyped for use in drawing visualisations such as the ones found in our student app.
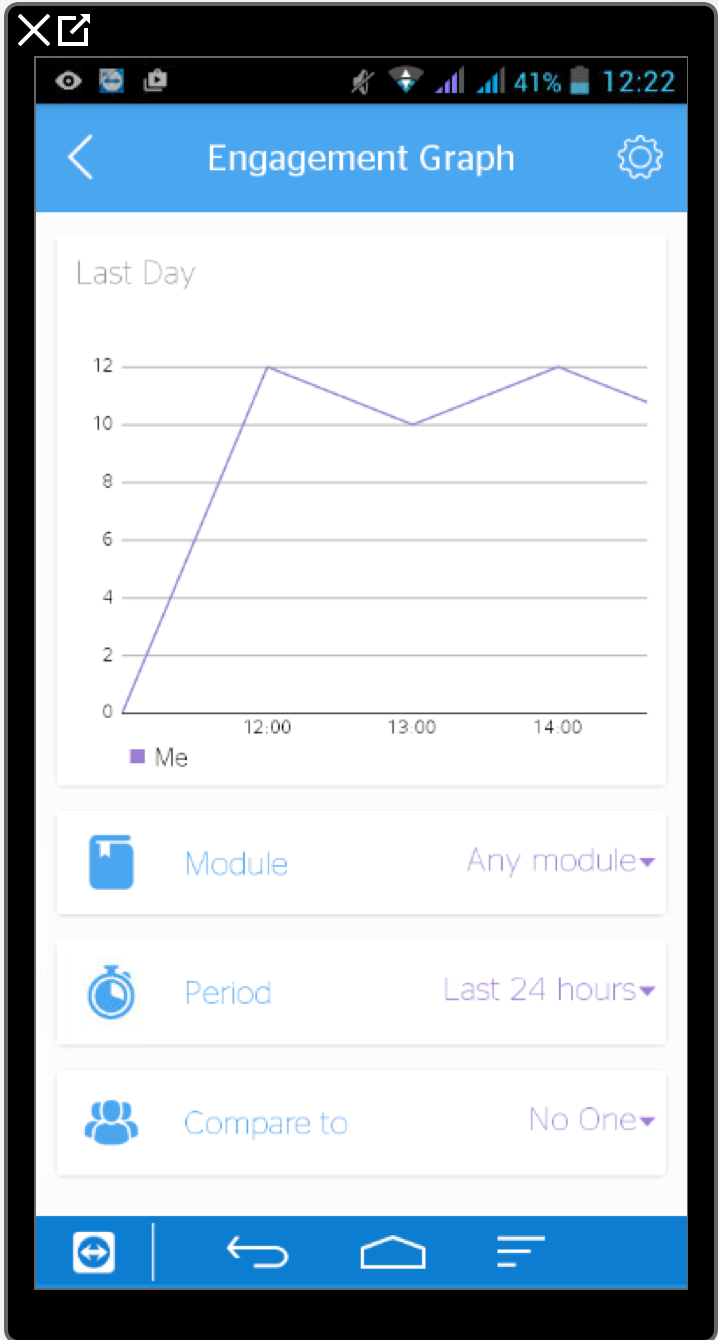
Student App Engagement graph
For example, issuing
http://jisc.learninglocker.net/api/v1/statements/aggregate?pipeline=[{"$match":{ }}, {"$group":{"_id":{"student":"$statement.actor.name"},"count":{ "$sum":1 }}}, {"$sort": {"count": -1}}, {"$limit": 20}]
will return the top 20 users by amount of activity statements, something like this (although for brevity there are only three users total in the sample dataset I ran the query against)
{
  "result": [
    {
      "_id": {
        "student": "madmin"
      },
      "count": 38
    },
    {
      "_id": {
        "student": "300"
      },
      "count": 12
    },
    {
      "_id": {
        "student": "92358969"
      },
      "count": 2
    }
  ],
  "ok": 1,
  "$gleStats": {
    "lastOpTime": {
      "sec": 0,
      "inc": 0
    },
    "electionId": {
      "$id": "576d8f82be4701f6cc85074b"
    }
  }
}
This seemed like such a useful toolkit that we’re expanding it into something institutions might use as a Data Explorer, which will help them to look through and understand their data once it is uploaded to a learning records warehouse, and offer them some off-the-shelf visualisations to show back at base.
Finally, as I mentioned at the beginning, we started off with VLEs, moved on to student records, but we’re now looking to extend our xAPI VLE approach to library data — watch this space for a future blog post about bringing Library systems into our solution!